
Eight days ago, the Seahawks looked lost. Four straight weeks of turnovers, quick pressure and stalled drives had people wondering what was left of the offense that won a Super Bowl. Then Seattle held Patrick Mahomes and the unbeaten Chiefs to 3 points. Kansas City never ran a play inside the 20, something that had not happened in 151 games with Mahomes at quarterback. Sam Darnold got the ball out faster than he had all season and was not sacked. Emanuel Wilson ran for 100 yards. Two days later, John Schneider traded for Quenton Nelson.
One week can change how a season feels. Monday night will show whether it changed what this team is.
The Bears are the right test. Mike Macdonald and Ben Johnson have each won one round against the other. In 2023, Macdonald’s Ravens held Johnson’s Lions to 6 points in a 38-6 rout. A year later, Johnson got even. Jared Goff completed all 18 of his passes, and Detroit hung 42 points on Macdonald’s first Seattle defense. That defense was missing Leonard Williams, Byron Murphy II, Uchenna Nwosu, Boye Mafe and Julian Love. Both men now run their own teams, and this is the rubber match.
Caleb Williams is not the quarterback Seattle sacked seven times in a 6-3 win in Chicago two seasons ago. He has grown into the kind of player Johnson’s offense was built for. DVOA ranks Chicago 17th, but that number carries three games with a backup at quarterback. With Williams on the field, the Bears are averaging plus-0.142 EPA per play, a pace that would rank fourth in the NFL.
The stakes are real for both teams. The HB playoff simulator rates this as the most important game left on Seattle’s schedule. Chicago and Seattle look like two teams that will be fighting over the same wild-card spots. Seattle already gave away one NFC game in Washington. It cannot afford a second.
The matchups lean Seattle. Chicago’s offense likes to get big and run the ball, and Seattle stops the run against heavy personnel as well as anyone. The Bears defense has allowed more yards per play than any team in the league. It ranks near the bottom against two-tight-end and fullback sets, which happen to be how Seattle likes to play. Nelson arrives just in time to lead the way, and Zach Charbonnet and Jadarian Price are expected back behind him.
Chicago still has its answers. Montez Sweat is back from suspension, Kyler Gordon has been a menace since returning in Week 6, and the Bears traded for Jeffery Simmons on Thursday. Monday is the first time all three play together. Their best coverage is Cover 1, and Cover 1 is the one look that has given Seattle the most trouble all year.
Seattle is a 3-point favorite. That feels right only if the Seahawks who played Kansas City show up again. If they do, this offense should have its best night of the season. If the version from the four games before that shows up, Johnson and Williams are good enough to make Seattle pay for every mistake.
Lineup Notes
Bears at Seahawks: who’s starting
Every starting spot next to the Week 1 depth chart, with each player’s snap share in the last game. They meet Monday, November 2.
| Player | 2025 | 2026 | What changed | |
|---|---|---|---|---|
| RB | Kyle Monangai | 41% 17/17 g | 24% 4/7 g | OUT |
| RB | Brittain Brown | 1% 2/17 g | – | Did not play IR |
| WR | Luther Burden III | 35% 15/17 g | 60% 7/7 g | Became a starter |
| WR | DJ Moore | 85% 17/17 g | – | Left Now BUF |
| WR | Olamide Zaccheaus | 50% 16/17 g | – | Left Now ATL |
| WR | Kalif Raymond | – | 61% 7/7 g | New With DET in 2025 |
| TE | Cole Kmet | 67% 16/17 g | 62% 7/7 g | IR |
| TE | Nikola Kalinic | 0% 0/17 g | – | Did not play IR |
| TE | Durham Smythe | 26% 17/17 g | – | Left Now BAL |
| TE | Sam Roush | – | 22% 7/7 g | New Rookie · Rd 3 |
| TE | Hayden Large | – | – | New Undrafted rookie IR |
| OL | Braxton Jones | 18% 4/17 g | 27% 3/7 g | IR |
| OL | Drew Dalman | 100% 17/17 g | – | Left No team listed |
| OL | Garrett Bradbury | – | 99% 7/7 g | New With NE in 2025 |
| Player | 2025 | 2026 | What changed | |
|---|---|---|---|---|
| EDGE | Dayo Odeyingbo | 34% 8/17 g | 40% 5/7 g | IR |
| DL | Gervon Dexter Sr. | 62% 17/17 g | – | Left Now ATL |
| DL | Andrew Billings | 48% 17/17 g | – | Left Now ARI |
| DL | Chris Williams | 20% 14/17 g | – | Left No team listed |
| DL | James Lynch | – | 44% 6/7 g | New With TEN in 2025 |
| DL | Kentavius Street | – | 43% 7/7 g | New With ATL in 2025 |
| DL | Neville Gallimore | – | 33% 7/7 g | New With IND in 2025 |
| LB | D'Marco Jackson | 25% 11/17 g | 58% 7/7 g | Became a starter |
| LB | Ruben Hyppolite II | 3% 4/17 g | – | Did not play IR |
| LB | Tony Fields II | – | – | Did not play IR |
| LB | Tremaine Edmunds | 76% 13/17 g | – | Left Now NYG |
| LB | Devin Bush | – | 94% 7/7 g | New With CLE in 2025 |
| LB | Nephi Sewell | – | – | New With NO in 2025 IR |
| CB | Jaylon Johnson | 26% 7/17 g | 97% 7/7 g | Became a starter |
| CB | Dallis Flowers | 0% 0/17 g | – | Did not play IR |
| CB | Nahshon Wright | 97% 17/17 g | – | Left Now NYJ |
| CB | Nick McCloud | 40% 13/17 g | 2% 1/7 g | Left no team |
| CB | Malik Muhammad | – | 74% 7/7 g | New Rookie · Rd 4 |
| CB | Cam Lewis | – | 72% 6/7 g | New With BUF in 2025 |
| S | Jaquan Brisker | 100% 17/17 g | – | Left Now PIT |
| S | Kevin Byard | 100% 17/17 g | – | Left Now NE |
| S | C.J. Gardner-Johnson | 53% 10/17 g | – | Left Now BUF |
| S | Xavier Woods | – | 31% 4/7 g | Left no team |
| S | Dillon Thieneman | – | 97% 7/7 g | New Rookie · Rd 1 |
| S | Coby Bryant | – | – | New With SEA in 2025 IR |
| Player | Pos | List | Last played | Week 1 chart | 2026 snaps |
|---|---|---|---|---|---|
| Dayo Odeyingbo | DL | IR | Week 5 | RDE1 · starter | 40% · 5 g |
| Braxton Jones | OL | IR | Week 3 | LT1 · starter | 27% · 3 g |
| Cole Kmet | TE | IR | Week 7 | TE2 | 62% · 7 g |
| Tony Fields II | LB | IR | Not in 2026 | WLB2 | None |
| Coby Bryant | DB | IR | Not in 2026 | FS3 | None |
| Dallis Flowers | DB | IR | Not in 2026 | RCB3 | None |
| Nephi Sewell | LB | IR | Not in 2026 | WLB3 | None |
| Brittain Brown | RB | IR | Not in 2026 | RB4 | None |
| Nikola Kalinic | TE | IR | Not in 2026 | TE4 | None |
| Ruben Hyppolite II | LB | IR | Not in 2026 | WLB4 | None |
| Hayden Large | TE | IR | Not in 2026 | TE5 | None |
| Player | Pos | List | Last played | Week 1 chart | 2026 snaps |
|---|---|---|---|---|---|
| Bud Clark | DB | IR | Not in 2026 | SS2 | None |
| Julian Neal | DB | IR | Week 4 | RCB2 | 0% · 1 g |
| Robbie Ouzts | RB | IR | Not in 2026 | FB2 | None |
| Elijah Arroyo | TE | IR | Week 6 | TE3 | 18% · 6 g |
| Jake Bobo | WR | IR | Not in 2026 | WR7 | None |
| Mason Richman | OL | IR | Not in 2026 | LG3 | None |
Charles Cross is out with an ankle injury, so Josh Jones starts at left tackle. That means an entirely new left side, with Nelson at left guard. Grey Zabel moves to right guard, and Jalen Sundell stays at center. Anthony Bradford, who started the Kansas City win, is questionable with a knee injury and would come off the bench.
Charbonnet and Price are both expected to play. Price practiced fully Friday and Saturday and is set to come off injured reserve. Charbonnet was a full participant Saturday after a limited Friday. Rashid Shaheed is out with a knee injury, and Tory Horton should take most of his snaps. Uchenna Nwosu is doubtful with an ankle injury, which makes Connor O’Toole the next edge up. Leonard Williams, Byron Murphy II and Drake Thomas all practiced fully Saturday and carry no designation.
For Chicago, running back Kyle Monangai is out. Linebacker D’Marco Jackson and cornerback Malik Muhammad are questionable. T.J. Edwards practiced fully all week after missing the last game with a hamstring injury. Tight end Cole Kmet is on injured reserve after getting hurt last week, and so is safety Coby Bryant, who signed with the Bears after Seattle’s Super Bowl run and has not played this season. Theo Benedet has started at left tackle since Braxton Jones went on injured reserve, with Ozzy Trapilo rotating in on his way back from injury.
Team Overview
Seahawks vs Bears SEA vs CHI · 2026 REGULAR SEASON |  vs  |
| SCORING & TURNOVERS | SEAHAWKS | Advantage | BEARS |
| POINT DIFFERENTIAL | 6th+6.1 | 7th+5.3 | |||
| TURNOVER DIFFERENTIAL | 23rd-3.0 | 27th-4.0 |
| NET EPA / PLAY | 7th+0.092 | 10th+0.058 | |||
| NET SUCCESS RATE | 6th+5.4% | 5th+5.6% | |||
| NET ESCAPE RATE | 13th+0.4% | 16th-0.3% |
| TOTAL DVOA | 5th+18.0% | 17th+3.4% | |||
| SPECIAL TEAMS DVOA | 9th+2.4% | 8th+2.5% |
These teams are closer by point differential than by anything else. Seattle ranks sixth at plus-6.1 a game, Chicago seventh at plus-5.3. DVOA, which adjusts for opponents, sees a bigger gap: Seattle fifth, Chicago 17th.
Neither team takes care of the ball. Seattle is minus-3 in turnover differential, 23rd. Chicago is minus-4, 27th.
Styles Make Fights
Seahawks Offensive Style SEA vs CHI · 2026 REGULAR SEASON | vs |
| TENDENCIES Rank in parentheses is how often they use it, not how well | SEAHAWKS OFFENSE | Advantage | BEARS DEFENSE |
| EPA / PLAY | EPA / PLAY ALLOWED | ||||
| MOTION 53% of plays (25th) · 235 plays | 26th-0.083 | 21st+0.016 | |||
| PLAY ACTION 26% of dropbacks (10th) · 65 plays | 12th+0.188 | 27th+0.250 | |||
| SHOTGUN 72% of dropbacks (28th) · 179 plays | 16th+0.073 | 9th-0.025 | |||
| UNDER CENTER 28% of dropbacks (5th) · 69 plays | 14th+0.152 | 28th+0.320 | |||
| SCREEN 11% of dropbacks (4th) · 28 plays | 4th+0.159 | 2nd-0.606 | |||
| NO HUDDLE 3% of plays (28th) · 12 plays | 7th+0.226 | 30th+0.460 |
| EPA / RUSH | EPA / RUSH ALLOWED | ||||
| OUTSIDE ZONE 40% of runs (4th) · 83 plays | 30th-0.297 | 25th-0.051 | |||
| INSIDE ZONE 17% of runs (16th) · 34 plays | 30th-0.375 | 13th-0.155 | |||
| MAN 13% of runs (28th) · 26 plays | 2nd+0.185 | 17th-0.120 | |||
| POWER 12% of runs (5th) · 24 plays | 18th-0.113 | 4th-0.415 |
Seattle’s screen game runs into the second-best screen defense in the league. The bigger opening is under center. Chicago ranks 28th defending snaps from under center and 27th against play action. Seattle goes under center on 28% of its dropbacks, fifth most.
Man-blocked runs are Seattle’s best concept, second in EPA per rush. Seattle still calls them on just 13% of its runs. Outside zone makes up 40% and ranks 30th. With Nelson in the lineup, that mix should start to change.
Bears Offensive Style SEA vs CHI · 2026 REGULAR SEASON | vs |
| TENDENCIES Rank in parentheses is how often they use it, not how well | BEARS OFFENSE | Advantage | SEAHAWKS DEFENSE |
| EPA / PLAY | EPA / PLAY ALLOWED | ||||
| MOTION 54% of plays (23rd) · 268 plays | 9th+0.054 | 1st-0.181 | |||
| PLAY ACTION 33% of dropbacks (1st) · 92 plays | 17th+0.103 | 4th-0.135 | |||
| SHOTGUN 70% of dropbacks (30th) · 194 plays | 11th+0.111 | 5th-0.068 | |||
| UNDER CENTER 30% of dropbacks (3rd) · 83 plays | 12th+0.182 | 4th-0.258 | |||
| SCREEN 10% of dropbacks (10th) · 27 plays | 7th+0.069 | 29th+0.288 | |||
| NO HUDDLE 5% of plays (20th) · 23 plays | 15th+0.051 | 1st-1.014 |
| EPA / RUSH | EPA / RUSH ALLOWED | ||||
| OUTSIDE ZONE 45% of runs (2nd) · 111 plays | 11th-0.075 | 11th-0.195 | |||
| MAN 16% of runs (19th) · 39 plays | 3rd+0.137 | 8th-0.248 | |||
| INSIDE ZONE 9% of runs (28th) · 23 plays | 28th-0.234 | 26th+0.024 | |||
| POWER 5% of runs (18th) · 12 plays | 20th-0.131 | 31st+0.457 |
Chicago leads the NFL in play-action rate, 33% of dropbacks, and goes under center third most. That plays into Seattle’s hands. The Seahawks rank fourth against both. The Bears are actually better without the frills. With Williams, their dropbacks without play action rank first in the league in EPA.
The screen game is the soft spot again. Seattle ranks 29th defending screens. Chicago ranks seventh running them.
Seahawks Offense vs. Bears Defense
Overview
Seahawks Offense SEA vs CHI · 2026 REGULAR SEASON | vs |
| OVERVIEW DVOA from FTN; the rest from nflverse plays | SEAHAWKS OFFENSE | Advantage | BEARS DEFENSE |
| POINTS PER GAME | 13th24.0 | 9th20.4 | |||
| EPA / PLAY | 21st-0.042 | 15th-0.011 | |||
| SUCCESS RATE | 20th42.0% | 6th41.1% | |||
| EXPLOSIVE PLAY RATE | 15th9.3% | 24th10.6% | |||
| ESCAPE RATE | 28th34.6% | 26th42.7% | |||
| TURNOVERS | 30th13 | 16th7 | |||
| DVOA | 22nd-9.1% | 18th+3.3% |
| PASSING vs PASS DEFENSE | 15th+18.1% | 15th+7.5% | |||
| RUSHING vs RUN DEFENSE | 29th-21.9% | 26th-3.5% |
| EPA / PLAY | EPA / PLAY ALLOWED | ||||
| 11 PERSONNEL 45% of snaps (28th) · 198 snaps · 76% pass | 16th-0.020 | 3rd-0.146 | |||
| 12 PERSONNEL 28% of snaps (10th) · 123 snaps · 52% pass | 22nd-0.039 | 29th+0.187 | |||
| 21 PERSONNEL 13% of snaps (5th) · 59 snaps · 32% pass | 12th+0.026 | 28th+0.153 | |||
| 22 PERSONNEL 8% of snaps (5th) · 36 snaps · 14% pass | 14th-0.082 | 26th+0.524 |
This Bears defense bends more than its rankings suggest. It ranks sixth in success rate allowed and last in yards per play allowed, at 6.3. The gap between those two numbers is big plays. Chicago ranks 24th in explosive play rate allowed and 25th in explosive pass rate allowed. It also struggles on early downs, 26th in first-down success rate allowed.
Third down is a different story. The Bears lead the NFL, allowing conversions on 26% of third downs. Seattle’s best path is to avoid third down as much as possible. Win first down, stay ahead of the sticks and take shots.
This is also not the defense on tape. Gordon has been a pass-down weapon since coming off the physically unable to perform list. On 16 pass rushes, he has 5 pressures, 4 sacks and 2 forced fumbles. Sweat got pressure on 13.3% of his rushes before his suspension. Simmons is one of the best defensive tackles in football.
Passing game
Seahawks Passing Game SEA vs CHI · 2026 REGULAR SEASON | vs |
| PASSING | SEAHAWKS OFFENSE | Advantage | BEARS DEFENSE |
| EPA / DROPBACK | 17th+0.095 | 13th+0.028 | |||
| DROPBACK SUCCESS RATE | 16th46.0% | 6th42.0% | |||
| EXPLOSIVE PASS RATE | 9th9.2% | 25th9.9% | |||
| COMPLETION % | 17th60.8% | 12th59.4% | |||
| INTERCEPTION RATE | 30th3.3% | 16th1.9% |
| PASS DVOA vs PASS DEFENSE DVOA | 15th+18.1% | 15th+7.5% |
| PRESSURE RATE | 22nd31.1% | 17th29.4% | |||
| TIME TO PRESSURE | 2nd2.90s | 18th2.60s | |||
| SACK RATE | 18th6.5% | 3rd8.5% |
| EPA WHEN PRESSURED | 16th-0.294 | 23rd-0.214 | |||
| EPA FROM A CLEAN POCKET | 5th+0.416 | 7th+0.196 | |||
| QUICK PRESSURES (≤2.5s) | 10th45.5% | 4th56.5% |
| EPA / DROPBACK | EPA / DROPBACK ALLOWED | ||||
| 11 PERSONNEL 45% of snaps (28th) · 151 dropbacks | 19th-0.037 | 3rd-0.174 | |||
| 12 PERSONNEL 28% of snaps (10th) · 64 dropbacks | 13th+0.190 | 30th+0.462 | |||
| 21 PERSONNEL 13% of snaps (5th) · 19 dropbacks | 5th+0.420 | 29th+0.693 |
| EPA / DROPBACK | EPA / DROPBACK ALLOWED | ||||
| BASE 37% of their snaps (7th) · 55 dropbacks | 11th+0.216 | 29th+0.381 | |||
| NICKEL 53% of their snaps (20th) · 139 dropbacks | 21st-0.019 | 9th-0.039 | |||
| DIME 9% of their snaps (12th) · 28 dropbacks | 6th+0.437 | 2nd-0.579 |
Cover 1 is the Bears’ best coverage, second in the league. It is Seattle’s worst, 31st. That is the single worst matchup on either side of this game.
Seattle did crack man coverage against Kansas City, going 7 of 9 for 94 yards. One game does not erase six. The coverage to attack is Cover 3, where Chicago ranks 29th.
Chicago blitzes on 39.6% of dropbacks, well above the league’s 30%. That may help Seattle. The Seahawks average plus-0.20 EPA per play when blitzed and minus-0.03 when they are not, the opposite of most offenses.
The four-man rush is the bigger threat, and Sweat is the reason. He has lined up against the right tackle on 111 of his 135 matchups with a tackle this season. That is Abraham Lucas.
Darnold can take care of a lot of this himself. Against Kansas City, he got rid of the ball in 2.32 seconds, his fastest game of the season. His share of throws out in under 2.5 seconds has climbed in each of his last five games, from 33% to 68%. Quick pressures fell to 13.3% of dropbacks, down from 21.4% over the first six games.
The protection plan changed too. Tight ends handled 89% of Seattle’s chips against Kansas City, up from 61%, which kept the backs free to run routes. Expect the same help for Lucas against Sweat.
Nelson helps too. He has not allowed a one-on-one sack in 50 straight games, nearly 2,000 snaps. He has also held his own against Simmons in recent seasons: an 11% pressure rate with no sacks when matched up one-on-one. Zabel faced Simmons alone five times last season and did not allow a pressure.
Receiving game
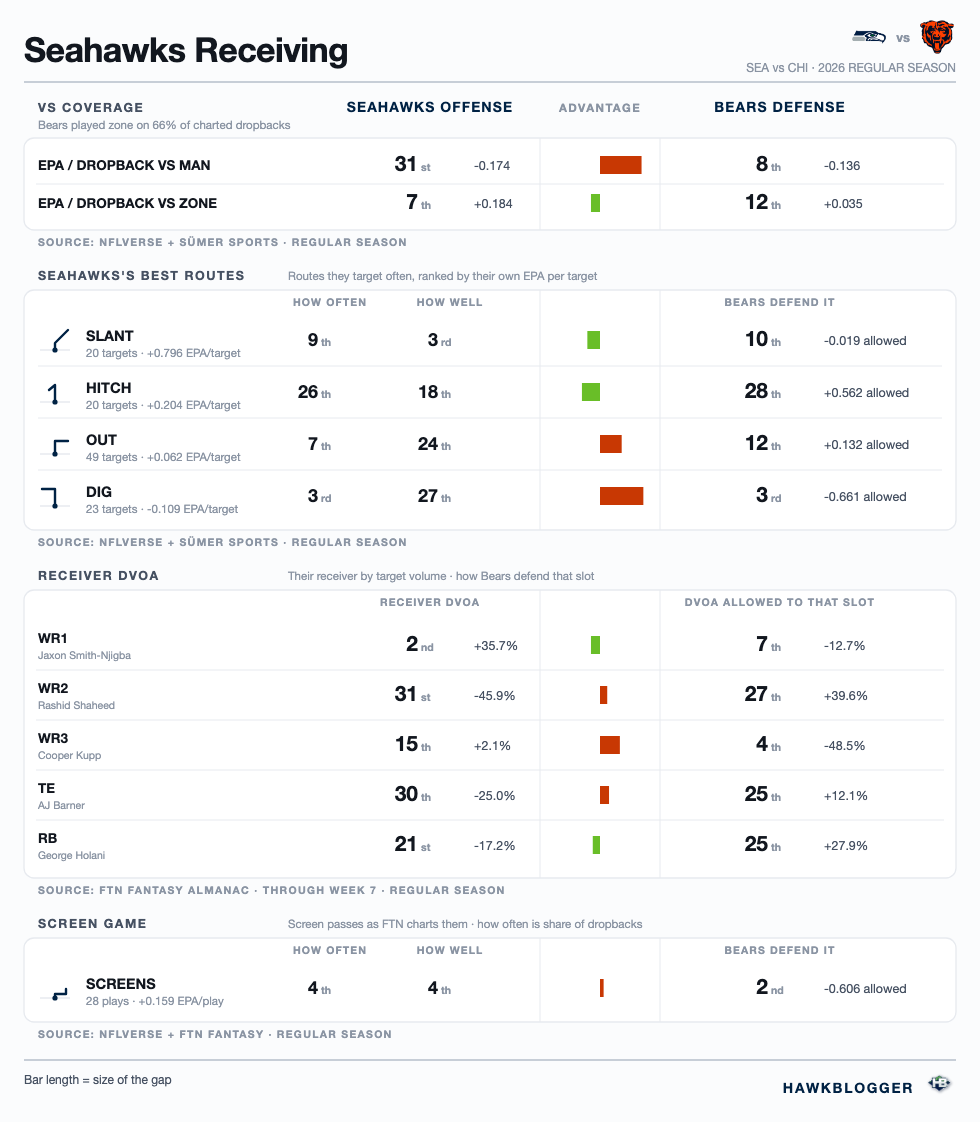
Jaxon Smith-Njigba has 867 yards through seven games. He needs 82 more to pass his own record for the best eight-game start by a Seahawk since 1999. Chicago’s cornerbacks have struggled this season. Jaylon Johnson and Tyrique Stevenson both rank among the 10 worst corners in the NFL in passer rating allowed. Malik Muhammad, the best of the group this year, is questionable with a toe injury.
The Bears rank seventh against WR1s and fourth against WR3s. They rank 27th against WR2s and 25th against tight ends. With Shaheed out, Horton gets the WR2 matchup. AJ Barner should find room against linebackers who have been stretched thin by injuries.
Cooper Kupp is the other man-beater. He averages plus-0.335 EPA per target against man coverage this season.
Run game
Seahawks Run Game SEA vs CHI · 2026 REGULAR SEASON | vs |
| RUNNING | SEAHAWKS OFFENSE | Advantage | BEARS DEFENSE |
| EPA / RUSH | 29th-0.155 | 19th-0.037 | |||
| RUSH SUCCESS RATE | 24th38.9% | 13th41.2% | |||
| EXPLOSIVE RUN RATE | 20th9.4% | 22nd11.8% |
| RUSH DVOA vs RUSH DEFENSE DVOA | 29th-21.9% | 26th-3.5% |
| POWER SUCCESS | 32nd41.2% | 4th54.5% | |||
| STUFFED RATE | 25th20.1% | 18th17.6% |
| EPA / RUSH | EPA / RUSH ALLOWED | ||||
| 11 PERSONNEL 45% of snaps (28th) · 52 rushes | 5th+0.162 | 17th+0.000 | |||
| 12 PERSONNEL 28% of snaps (10th) · 61 rushes | 28th-0.224 | 16th-0.057 | |||
| 21 PERSONNEL 13% of snaps (5th) · 40 rushes | 15th-0.161 | 13th-0.146 |
| EPA / RUSH | EPA / RUSH ALLOWED | ||||
| BASE 37% of their snaps (7th) · 77 rushes | 25th-0.212 | 21st-0.041 | |||
| NICKEL 53% of their snaps (20th) · 55 rushes | 21st-0.046 | 17th-0.011 | |||
| DIME 9% of their snaps (12th) · 4 rushes | 3rd+1.086 | 3rd-0.318 |
Seattle ranks 29th in EPA per rush. Chicago ranks fourth in power success, and Seattle ranks last. The way in is heavy personnel. The Bears rank 29th against 12 personnel, 28th against 21 and 26th against 22. Seattle uses all three more than most teams.
Seattle already started down this road against Kansas City. The coaches called more power and man-blocked runs, leaned on 22 personnel and got 100 yards from Wilson. Expect more of the same.
Run left. Seattle’s gap-scheme man runs to the left have produced plus-0.39 EPA per carry on 15 tries. That is Nelson’s side now. He has 13.3 positive run blocks per 100 run snaps, against 7.6 for the average guard.
Both backs should play. Price brings the long runs, with 18% of his carries going for 10 or more yards. Charbonnet brings the short-yardage running and the blitz pickup. George Holani has allowed 18.4 pressures per 100 pass blocks this season. Charbonnet allowed about 6 per 100 in 2023 and 2024. Put Nelson and the two backs together, and the projection adds about 2.4 expected points a game to this offense, most of it on the ground. Wilson just ran for 100 yards against Kansas City. Seattle has not had this many options in the backfield all season.
Bears key advantages on defense
Cover 1 and third down. Dennis Allen builds a new plan for every opponent, and Gordon gives him a pass-down weapon he can line up anywhere. Sweat against Lucas could decide a few drives. Simmons gives the Bears an interior player who can wreck a game on his own.
Seahawks key advantages on offense
A secondary that gives up big plays. A defense that struggles against heavy personnel and on first down. Nelson’s run blocking. Smith-Njigba against corners who have struggled all season. Watch out for Tory Horton and Cooper Kupp playing larger roles in this one as well.
Bears Offense vs. Seahawks Defense
Overview
Seahawks Defense SEA vs CHI · 2026 REGULAR SEASON | vs |
| OVERVIEW DVOA from FTN; the rest from nflverse plays | BEARS OFFENSE | Advantage | SEAHAWKS DEFENSE |
| POINTS PER GAME | 8th25.7 | 4th17.9 | |||
| EPA / PLAY | 12th+0.047 | 2nd-0.134 | |||
| SUCCESS RATE | 10th46.7% | 2nd36.5% | |||
| EXPLOSIVE PLAY RATE | 9th10.5% | 2nd5.2% | |||
| ESCAPE RATE | 13th42.4% | 3rd34.2% | |||
| TURNOVERS | 25th11 | 3rd10 | |||
| DVOA | 14th+4.2% | 1st-24.7% |
| PASSING vs PASS DEFENSE | 12th+25.7% | 2nd-22.0% | |||
| RUSHING vs RUN DEFENSE | 15th-6.0% | 3rd-28.3% |
| EPA / PLAY | EPA / PLAY ALLOWED | ||||
| 11 PERSONNEL 47% of snaps (26th) · 236 snaps · 66% pass | 4th+0.160 | 4th-0.128 | |||
| 12 PERSONNEL 34% of snaps (4th) · 170 snaps · 49% pass | 23rd-0.064 | 3rd-0.149 | |||
| 13 PERSONNEL 17% of snaps (4th) · 85 snaps · 40% pass | 17th-0.002 | 1st-0.480 |
Seattle’s defense ranks first in DVOA and second in EPA per play, success rate and explosive play rate. Chicago’s season numbers rank in the middle of the league, but those include the games without Williams.
The Bears have a two-speed offense. With Williams, Chicago ranks first in the NFL in EPA per play out of 11 personnel. In 12 personnel, it drops to 28th. Two- and three-tight-end sets make up 57% of their snaps, against 33% league-wide. Seattle ranks third against 12 personnel and first against 13. Kmet’s injury may push Johnson toward more three-receiver sets, which is exactly where Chicago is most dangerous.
Pass game
Seahawks Pass Defense SEA vs CHI · 2026 REGULAR SEASON | vs |
| PASSING | BEARS OFFENSE | Advantage | SEAHAWKS DEFENSE |
| EPA / DROPBACK | 10th+0.133 | 2nd-0.107 | |||
| DROPBACK SUCCESS RATE | 8th49.8% | 2nd39.0% | |||
| EXPLOSIVE PASS RATE | 5th10.5% | 1st3.5% | |||
| COMPLETION % | 5th64.0% | 8th57.8% | |||
| INTERCEPTION RATE | 16th1.9% | 3rd3.5% |
| PASS DVOA vs PASS DEFENSE DVOA | 12th+25.7% | 2nd-22.0% |
| PRESSURE RATE | 24th32.4% | 4th36.4% | |||
| TIME TO PRESSURE | 4th2.81s | 14th2.56s | |||
| SACK RATE | 19th6.5% | 10th6.8% |
| EPA WHEN PRESSURED | 4th-0.028 | 9th-0.353 | |||
| EPA FROM A CLEAN POCKET | 22nd+0.240 | 2nd+0.075 | |||
| QUICK PRESSURES (≤2.5s) | 6th44.1% | 11th52.8% |
| EPA / DROPBACK | EPA / DROPBACK ALLOWED | ||||
| 11 PERSONNEL 47% of snaps (26th) · 155 dropbacks | 6th+0.177 | 4th-0.139 | |||
| 12 PERSONNEL 34% of snaps (4th) · 84 dropbacks | 14th+0.149 | 10th+0.026 | |||
| 13 PERSONNEL 17% of snaps (4th) · 34 dropbacks | 21st+0.024 | 1st-0.758 |
| EPA / DROPBACK | EPA / DROPBACK ALLOWED | ||||
| BASE 11% of their snaps (31st) · 8 dropbacks | 19th+0.099 | 3rd-0.306 | |||
| NICKEL 69% of their snaps (9th) · 172 dropbacks | 11th+0.093 | 6th-0.115 | |||
| DIME 19% of their snaps (3rd) · 67 dropbacks | 7th+0.422 | 12th-0.090 |
Williams holds the ball 3.07 seconds before throwing, longest in the league. He is pressured on 44% of dropbacks and sacked on 8%. He is still positive when pressured, plus-0.14 EPA per dropback, against minus-0.345 for the average quarterback. Seattle ranks fourth in pressure rate without needing to blitz. The soft spot on Chicago’s line is left guard Joe Thuney. That is where Byron Murphy II, with a 13.1% pressure rate, and Williams, at 9.7%, will look to get home.
Williams breaks the pocket on 32% of his dropbacks, second most in the NFL. Seattle forces quarterbacks out of the pocket more than any defense in the league. Once they are out, throws on the move against Seattle rank fourth best in the league. The scramble is the problem. Drake Maye scrambled six times in Week 1, and five of them moved the chains. Williams scrambles on 9.3% of his dropbacks, nearly double the league rate.
Coverage will be the chess match. Williams is the best quarterback in the NFL against Cover 2 and third best against Cover 4. Seattle plays two-high shells on 58% of its dropbacks. His worst coverage is Cover 1, where Seattle ranks first in the league. Macdonald rarely calls it, just 10% of the time. History says he does not need to. Against quarterbacks who beat two-high coverage, he has played more of it, not less, and they have averaged minus-0.09 EPA per dropback against it. Those same quarterbacks averaged plus-0.20 against everyone else’s.
Receiving game
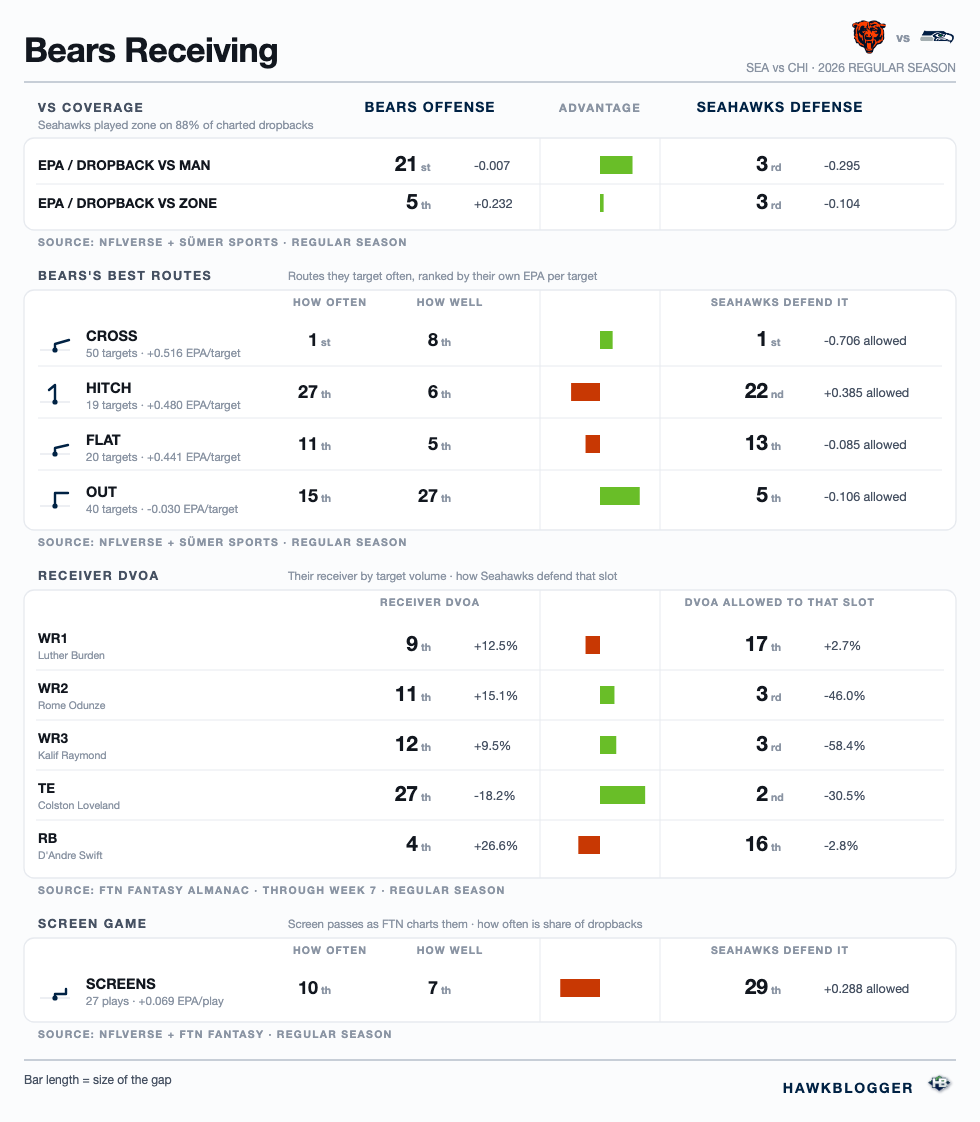
Seattle’s soft spot in coverage is the middle of the field, where the linebackers live. Ernest Jones IV has allowed 24 catches on 29 targets. Colston Loveland lines up inside on 74% of his routes, and Luther Burden III on 57%. Burden is the kind of receiver who can hurt Seattle. He is dangerous after the catch, and Seattle has struggled with tackle breakers on screens.
Rome Odunze does his damage deep, with an average depth of target of 14.5 yards. That is where Seattle gives up the least. Seattle allows the lowest explosive pass rate in the league, 3.5%.
D’Andre Swift ranks fourth among backs in receiving DVOA. Seattle ranks 16th against running backs. That is the one spot where Chicago has a real weapon against an average Seattle matchup.
Running game
Seahawks Run Defense SEA vs CHI · 2026 REGULAR SEASON | vs |
| RUNNING | BEARS OFFENSE | Advantage | SEAHAWKS DEFENSE |
| EPA / RUSH | 13th-0.016 | 3rd-0.124 | |||
| RUSH SUCCESS RATE | 13th43.9% | 1st33.7% | |||
| EXPLOSIVE RUN RATE | 16th10.5% | 3rd7.4% |
| RUSH DVOA vs RUSH DEFENSE DVOA | 15th-6.0% | 3rd-28.3% |
| POWER SUCCESS | 20th60.7% | 15th63.6% | |||
| STUFFED RATE | 7th15.5% | 4th21.9% |
| EPA / RUSH | EPA / RUSH ALLOWED | ||||
| 11 PERSONNEL 47% of snaps (26th) · 91 rushes | 3rd+0.167 | 14th-0.041 | |||
| 12 PERSONNEL 34% of snaps (4th) · 92 rushes | 27th-0.219 | 2nd-0.260 | |||
| 13 PERSONNEL 17% of snaps (4th) · 54 rushes | 11th+0.005 | 10th-0.276 |
| EPA / RUSH | EPA / RUSH ALLOWED | ||||
| BASE 11% of their snaps (31st) · 37 rushes | 21st-0.144 | 1st-0.354 | |||
| NICKEL 69% of their snaps (9th) · 120 rushes | 7th+0.064 | 5th-0.147 | |||
| DIME 19% of their snaps (3rd) · 14 rushes | 1st+3.955 | 17th+0.455 |
Swift has a rushing touchdown in three straight games and seven on the season. One more breaks Matt Forte’s mark for the most through eight games by a Bear since 1999. Monangai, who has split the work with Swift, is out.
Chicago runs outside zone on 45% of its runs, second most in the league, and it has not worked that well. With Williams, its outside zone runs average minus-0.14 EPA. Its man-blocked runs are much better, plus-0.37 on 20 carries. Seattle ranks first in rush success rate allowed. Kansas City ran 16 times for 50 yards in Seattle last week.
The Bears line is good at creating space on the edges, and setting the edge is how Seattle stops that. Nwosu is doubtful, and losing him would hurt there. Connor O’Toole is the next edge up.
Bears key advantages on offense
Williams off script. Three-receiver sets. Screens to Burden and Swift against a defense that ranks 29th against them. Johnson also had 11 days to prepare after playing on a Thursday.
Seahawks key advantages on defense
A pass rush that gets home without blitzing against a quarterback who holds the ball. Cover 1, if Macdonald wants it. Elite play against heavy personnel. The last time Williams faced this defense, he was sacked seven times.
The red zone is the one place to worry. Seattle ranks 31st, allowing touchdowns on 68.8% of trips inside the 20.
Special Teams
Seahawks Special Teams SEA vs CHI · 2026 REGULAR SEASON | vs |
| OVERALL Estimated points above average | SEAHAWKS | Advantage | BEARS |
| SPECIAL TEAMS DVOA | 9th+2.4% | 8th+2.5% | |||
| FIELD GOALS & XP | 7th3.9 | 25th-3.6 |
| KICKOFFS vs BEARS KICK RETURN | 27th-4.3 | 22nd-1.4 | |||
| PUNTING vs BEARS PUNT RETURN | 1st7.7 | 8th0.7 |
| KICK RETURN vs BEARS KICKOFFS | 31st-4.8 | 2nd6.6 | |||
| PUNT RETURN vs BEARS PUNTING | 4th2.8 | 6th3.1 |
Special teams are close overall. Seattle ranks ninth in special teams DVOA, Chicago eighth. Seattle ranks seventh on field goals and extra points. Chicago ranks 25th.
Seattle’s punting ranks first. The return game is the weak spot again. Seattle ranks 31st in kick return, against a Bears kickoff unit that ranks second.
Key to a Bears win
Williams makes plays off script and turns scrambles into first downs. Allen’s pressure packages and new defensive line speeds up Darnold, and forces turnovers.
Key to a Seahawks win
Communication across a newly configured offensive line, both pre-snap and during the play. Avoid obvious passing situations, and continue to get the ball out quickly.